
Website performance metrics executives should track
Understanding the right website performance metrics enables executives to make data-driven decisions that directly impact business growth and customer satisfaction.
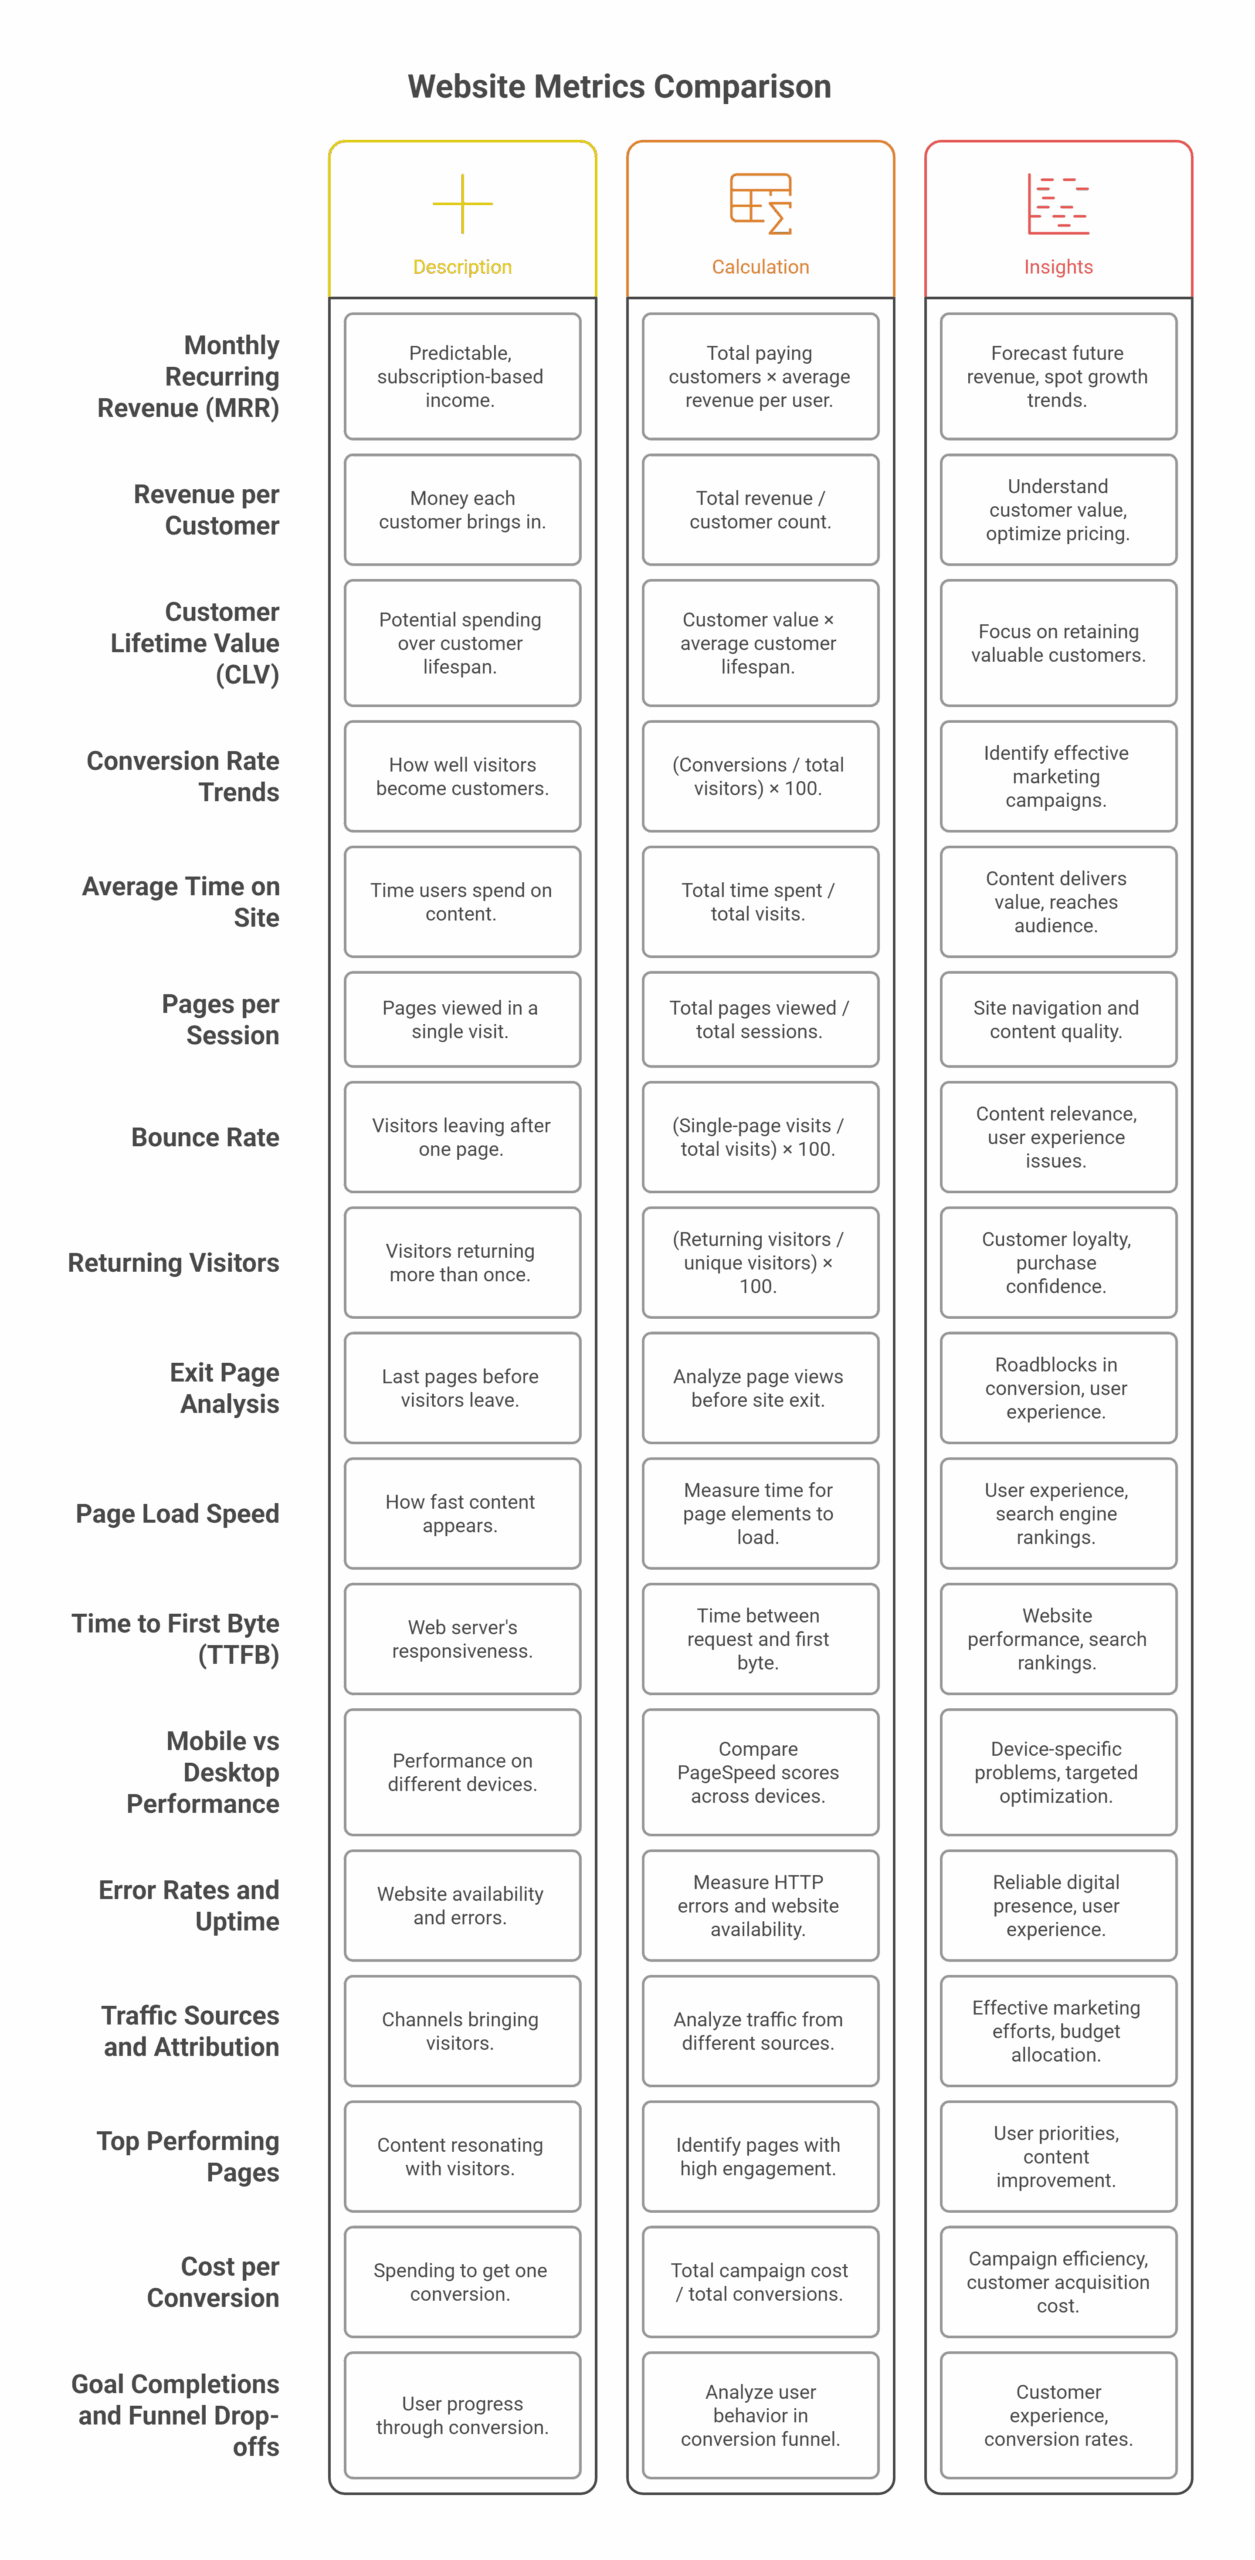
- Track revenue-focused metrics first: Monitor MRR, customer lifetime value, and conversion rates to directly connect website performance to business outcomes and profitability.
- User engagement reveals content effectiveness: Average time on site, bounce rates, and pages per session indicate whether your content resonates with visitors and drives desired actions.
- Technical performance directly impacts conversions: Page load speeds over 3 seconds cause visitor abandonment, making TTFB and mobile optimization critical for revenue protection.
- Strategic alignment drives optimization: Analyze traffic sources, funnel drop-offs, and cost per conversion to identify high-impact improvement opportunities and allocate resources effectively.
- View metrics holistically, not in isolation: Combine engagement, technical, and revenue data to uncover actionable insights—like slow load times causing high bounce rates and lost conversions.
The most successful executives use these metrics as a compass for strategic decision-making, focusing on data that transforms website traffic into measurable business value rather than pursuing vanity metrics that don’t drive growth.
Which website performance metrics should executives focus on most?
Executives should prioritize revenue-driven metrics such as conversion rate, monthly recurring revenue (MRR), customer lifetime value (CLV), and cost per conversion. These metrics directly link website performance to business growth and profitability, unlike vanity metrics such as raw traffic.
Web analytics metrics serve as a guiding light for executives navigating the digital world of their business. Successful websites show an average session duration close to 3 minutes. Their bounce rates hover around 40%. These numbers reveal your website’s health and its business potential.
Our experience shows that tracking the right website metrics helps us spot meaningful patterns. We can make evidence-based decisions that directly affect results. Website analytics help measure performance against business goals and spot areas needing improvement. These metrics reveal visitor patterns – who comes to our site, their visit timing, and their reasons. This knowledge lets us evaluate the success of our digital marketing campaigns.
This piece explores key metrics executives should watch to ensure their websites support business goals effectively. We’ve arranged these metrics into practical categories that match your strategic priorities. You’ll find everything from revenue indicators to user signals and technical performance standards.
Revenue and Growth Metrics
How does website performance directly impact revenue?
Website performance impacts revenue through conversion rates, customer retention, and purchase behavior. Slow load times, poor mobile performance, or broken funnels increase bounce rates and reduce conversions, directly lowering revenue and lifetime customer value.
Your website’s financial performance metrics tell you exactly how it helps grow your business. These metrics link website performance to revenue and help executives make smart decisions.
Monthly recurring revenue (MRR)
Monthly recurring revenue shows the predictable, subscription-based income a company expects each month. Companies with subscription models calculate MRR by multiplying their total paying customers by the average revenue per user. To name just one example, see a company with 100 customers paying USD 100 per month – their MRR would be USD 10,000.
MRR tracking gives you a clear picture to forecast future revenue, spot growth trends, and find problem areas. On top of that, it helps to break down MRR into categories like New MRR, Expansion MRR, and Churn MRR to learn more about revenue performance.
Revenue per customer
Revenue per customer shows how much money each customer brings in. This helps executives understand customer value and see if their pricing works. You can find this number by dividing total revenue by customer count. To cite an instance, a company making USD 1,000,000 from 1,000 customers would have USD 1,000 revenue per customer.
This number helps you spot your most valuable customer groups, make better pricing choices, and see if your upselling and cross-selling efforts pay off. E-commerce businesses might want to track average order value instead of revenue per customer.
Customer lifetime value (CLV)
Customer lifetime value shows how much a customer might spend with your company over time. The simple CLV formula works like this: Customer lifetime value = Customer value × average customer lifespan. A mere 5% increase in CLV can boost profits by 25% or more, sometimes leading to a 95% profit increase.
CLV helps businesses put their resources into keeping valuable customers rather than always chasing new ones. This makes sense since selling to existing customers is up to 14 times easier than to new ones.
Conversion rate trends
Conversion rate trends reveal how well your website turns visitors into paying customers. Businesses of all types average around 2.9%. These rates change by a lot based on industry and marketing channel. Direct traffic does better with a 3.3% average rate.
These trends let executives see which marketing campaigns work best, spot seasonal patterns, and notice how website changes affect their bottom line.
User Engagement Metrics
Why should executives track user engagement metrics?
User engagement metrics like time on site, pages per session, and returning visitors indicate whether content resonates with users and supports buying decisions. Strong engagement often precedes higher conversions, while weak engagement signals messaging or UX problems.
Your website’s effectiveness becomes clear when you understand how visitors interact with it. These engagement metrics show visitor behavior patterns that directly affect conversion potential.
Average time on site
The average time on site shows how long users spend with your content during a visit. This metric has become a vital indicator of attention that marketers focus on in 2025. A high average time suggests your content delivers value and reaches the right audience. GA4 calls this metric “average engagement time per session” – a more accurate reflection of real user interaction versus passive page viewing.
Pages per session
Pages per session shows the number of pages visitors view in a single website visit. Most industries average about 5 pages per session. Businesses with more product options like apparel (9.01) see higher page views than B2B services (2.2-3.1). This metric helps you review your site’s navigation and content quality. When users view more pages, it usually means they find your content engaging.
Bounce rate
The bounce rate tells you what percentage of visitors leave after seeing just one page without any interaction. A good bounce rate ranges from 26-40%, while 41-55% is average. The context matters here – blogs tend to have higher bounce rates than ecommerce sites, which typically see 20-45%. GA4 has changed this to “engagement rate” that focuses on positive interactions instead of exits.
Returning visitors
Returning visitors come back to your website more than once within a set time period. You can calculate this using: RVR = (Number of Returning Visitors / Total Number of Unique Visitors) x 100. Websites should aim for about 30% returning visitors – much higher numbers might mean people don’t feel confident buying during their first visit.
Exit page analysis
Exit pages are the last stops before visitors leave your site. Looking at these pages helps find potential roadblocks in conversion or user experience. Some exits make sense, like thank-you pages, but high exit rates during checkout need investigation. Exit patterns can reveal a lot about your content’s relevance and technical issues that need fixing.
Technical Performance Metrics
Which technical website metrics have the biggest business impact?
Page load speed, Time to First Byte (TTFB), mobile performance, and uptime have the greatest impact. Pages loading over 3 seconds significantly increase abandonment rates, directly affecting conversions, SEO visibility, and revenue.
Technical website metrics affect both user experience and bottom-line results. Users abandon websites that take longer than three seconds to load. Tracking these metrics is vital for executive decision-making.
Page load speed
Page load speed shows how fast your website content appears to visitors. This term includes multiple metrics that track different loading stages. Slow loading pages reduce conversion rates because visitors leave sites that take more than three seconds to load. Teams can identify optimization opportunities by monitoring page speed. This approach improves user experience and search rankings.
Time to first byte (TTFB)
TTFB shows your web server’s responsiveness by measuring the time between a browser request and the first byte of response. A “good” TTFB score ranges from 0-800ms, while scores above 1.8 seconds indicate poor performance. Google uses TTFB as a core metric to calculate your website’s performance score, which affects search rankings.
Mobile vs desktop performance
Mobile devices have slower connections and less processing power than desktops, which creates different performance profiles. Mobile PageSpeed scores differ from desktop scores because of hardware limitations and connection differences. Teams can identify device-specific problems that need targeted optimization by tracking both metrics separately.
This phase helps catch issues before real visitors see them. The core team who didn’t work on the design can give fresh insights into how intuitive the new design feels. Strong feedback systems like small focus groups help exchange ideas about the revised process.
Error rates and uptime
Error rates measure HTTP errors such as 404 (Not Found) or 500 (Internal Server Error) that disrupt user experience. Uptime monitoring checks your website’s availability and alerts teams about outages before customers notice them. These metrics help maintain a reliable and available digital presence.
Strategic Alignment and Optimization
How should executives use website metrics for strategic decisions?
Executives should analyze website metrics holistically by combining revenue, engagement, and technical data. This approach reveals root causes—such as slow load times driving high bounce rates—and supports smarter resource allocation and optimization strategies.
Successful websites need business objectives that line up with performance data. Business leaders must track metrics that show how user behavior connects to business results.
Traffic sources and attribution
Traffic source analytics show which channels bring visitors to your website. B2B businesses see their highest conversion rates from organic search at 2.6% and email channels at 2.4%. Traffic attribution helps you spot which marketing efforts produce the best results. This lets you allocate your budget more wisely. The data connects your SEO performance to revenue, visibility, and customer engagement.
Top performing pages
Your top-performing pages show which content strikes a chord with visitors. These pages are your most valuable digital assets and point to ways you can improve. Unlike vanity metrics, data from top pages reveals useful patterns about user priorities and intent.
Cost per conversion
Cost per conversion shows how much you spend to get one conversion, like a sale or sign-up. You can calculate it by dividing total campaign cost by total conversions. A good cost per conversion should be lower than customer lifetime value by a lot. WordStream reports average costs of USD 48.96 for search and USD 75.51 for display ads.
Goal completions and funnel drop-offs
Funnel analysis shows where users leave during their conversion trip. Looking at drop-off points helps you optimize the customer experience and increase conversion rates. Small improvements can affect revenue substantially. A single USD 25 order lost each day due to technical problems adds up to USD 9,125 in lost revenue yearly.
Conclusion
Website performance metrics act as a digital compass that guides business decisions through evidence-based analysis rather than gut feelings. This piece explores key metrics across four vital categories that executives should track.
Revenue and growth metrics, without doubt, link website performance to business outcomes. The trends in monthly recurring revenue, revenue per customer, customer lifetime value, and conversion rates tell a powerful story about the website’s financial effect. These numbers turn website traffic into real business value.
Visitor behavior reveals how users interact with our digital presence. Time spent on site, pages viewed per session, bounce rate, returning visitors, and exit page analysis show how well the content works and whether users are satisfied. Understanding these metrics helps create experiences that appeal to our audience.
Technical performance metrics such as page load speed, time to first byte, mobile versus desktop performance, and error rates shape both user experience and search visibility. Websites that load quickly and work reliably simply perform better across all business metrics.
Strategic metrics connect user behavior to business strategy. Traffic sources, top-performing pages, cost per conversion, and funnel drop-offs show where we can optimize and grow. These numbers help allocate resources better.
The real value comes from viewing these metrics as a whole rather than separately. A high bounce rate combined with slow page loads and high exit rates on checkout pages points to technical problems that hurt conversions. Strong user engagement paired with low conversion rates might indicate pricing or offer issues.
Website analytics must drive action and improvement rather than becoming a vanity exercise. Focus on these vital metrics helps make smart decisions that accelerate business growth, boost customer satisfaction, and build competitive advantage in today’s digital world.
Frequently Asked Questions
What are the most important website performance metrics for executives to monitor?
The key metrics executives should track include Monthly Recurring Revenue (MRR), Customer Lifetime Value (CLV), conversion rates, average time on site, page load speed, and cost per conversion. These metrics provide insights into revenue growth, user engagement, technical performance, and strategic alignment.
How does page load speed impact a website's performance?
Page load speed significantly affects user experience and conversion rates. Visitors are more likely to abandon websites that take longer than three seconds to load. Monitoring page speed helps identify optimization opportunities, improving both user experience and search engine rankings.
What is a good bounce rate for a website?
A good bounce rate typically falls between 26-40%, while 41-55% is considered average. However, context matters – blogs naturally have higher bounce rates than e-commerce sites, which average 20-45%. It’s important to analyze bounce rates in conjunction with other engagement metrics for a comprehensive understanding.
How can executives use traffic source data to improve website performance?
By analyzing traffic sources, executives can identify which marketing channels drive the most valuable visitors to their website. This information helps in allocating marketing budgets more effectively and optimizing campaigns for better results. For instance, organic search and email channels typically generate the highest conversion rates for B2B businesses.
Why is it important to track both mobile and desktop performance separately?
Mobile devices generally have slower connections and processing power compared to desktops, resulting in distinct performance profiles. Tracking mobile and desktop performance separately helps identify device-specific issues that require targeted optimization, ensuring a consistent user experience across all platforms.

Author: Arsh Sanwarwala
Arsh Sanwarwala is the Founder and CEO at ThrillX. He is passionate about UX/UI Design, conversion optimization, and all things digital.